O'Reilly Radar started a new series this month tagged: Strata Gems
Example: using Twitter for graphs:
 |
| Taken from post. |
Example:

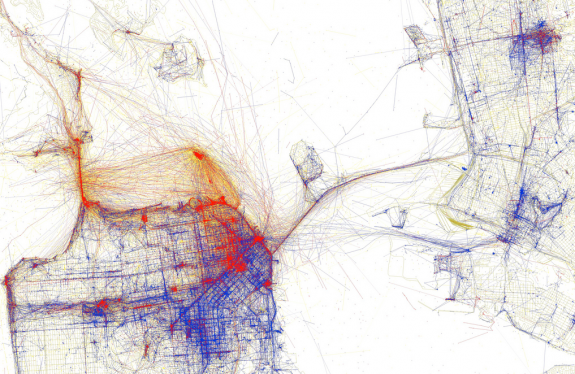
Finally, this post details 10 Best Data Visualization Projects:
Example: Where the Tourist Really Flock (using Flickr)

 |
| Taken from post. |

Eigenfactor is currently looking into how to incorporate real-time usage data, as well as “citation-like references” from scholars on social networking sites. Shout-outs on scholarly blogs, Twitter, and Facebook, along with digital dog-earing on social bookmarking sites such as CiteULike and Connotea, might also be used as proxies for influence
 |
| image from the MESUR website. |
More often tenure provides a lifetime of job security not to professors whose work requires protection, but to a significant minority of "deadwood" — individuals who are unproductive, out of date, or poor in their research, teaching or institutional commitment.
